Databases
HYPERDOC dataset
Our hyperspectral dataset contains 1681 hyperspectral images of different synthetic and historical documents that have all been captured in two spectral ranges, VNIR (Visible and Near-Infrared, 400-1000 nm) and SWIR (Short-Wavelength Infrared, 900-1700 nm).
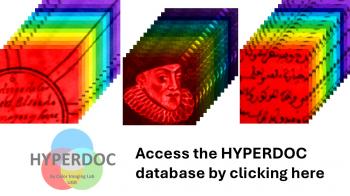
This dataset has been built with the objective of having a large repository of spectral information of inks, pigments and substrates used historically. Most of the dataset is composed of synthetic samples crafted in recent years with historical recipes, and the rest of the samples are captures of documents preserved in historical archives in Granada, Spain, dating from the 15th to the 20th centuries.
Funding: Sponsored by the Spanish Ministry of Science, Innovation and Universities (Grant PID2021-124446-NB100 financed by MICIU/AEI /10.13039/501100011033 and FEDER, UE)
The dataset can be freely used for research and academic purposes.
For any use of our dataset for commercial purposes, please contact us via email at colorimg@ugr.es
Granada hyperspectral hazy database (GRANHHADA)
The GRANHHADA database consists of 35 outdoor scenes which were captured at different locations and under different atmospheric conditions. We used two capture devices which cover either visible and near-infrared (VIS/NIR) or only near-infrared (SWIR). Fifteen scenes were captured on a very clear winter day without any fog or haze: five scenes in the VIS/NIR range from the observation tower of the Parque de las Ciencias (50 m high), five scenes in the VIS/NIR range from an elevated location above the village of Las Gabias (approximately 200 m above the height of the city of Granada, Spain) and five additional scenes in the SWIR range also from the observation tower of the Parque de las Ciencias. The remaining 20 scenes were captured in presence of haze of natural origin and in the VIS/NIR range: ten of them from an elevated location above the city of Granada and the other ten either from the rooftop of a building (height approximately 18 m, 7 scenes) in Granada or from the elevated location above the village of Las Gabias. Granada city has a latitude of 37°10′41″N, a longitude of 3°36′03″W, and an altitude of 684 meters.
The capture device used for VIS/NIR range (from 397 to 1004 nm) was a SPECIM-IQ hyperspectral camera [33] based on a CMOS sensor with 512 x 512 pixels spatial resolution, with 204 different spectral channels. For each scene, a raw capture of the scene and a raw capture of a reference white sample as well as a dark image were captured. With this information, the spectral reflectance image (Cuberef) was then calculated by correcting each pixel of the raw image by applying a flat field correction.
In the SWIR range, the capture device used was a PIKA NIR-640 hyperspectral camera. This camera is based on a linear sensor (InGaAs) with 640 pixels of spatial resolution (640 x 1200 pixels as final size), covering a wavelength range between 888 and 1732 nm with 336 different channels. We used the “spectral binning” option to increase the sensor response by decreasing the number of channels, so our images consist of 168 channels. In such a case, the camera is radiometrically calibrated to convert raw to radiance, so the radiance cube is obtained directly
You can download clicking here
The database can be freely used for research and academic purposes.
Funding: The Spanish Ministry of Science Innovation and Universities (MICINN, grant number RTI2018-094738-B-100) and the Junta de Andalucía (grant number A-TIC-050-UGR18), both financed with FEDER Funds.
UGR Spectral Saliency Database

This database contains 8-channels multispectral images of urban scenes, together with their RGB versions, as well as saliency maps (heat maps) captured using an eyetracker device on real observers. Three rounds of eyetracker measurements were performed: one with 1147 images and two with 136 images (categorization and free-viewing).
The content of the database is the following:
- Heat maps 1147 final: final processed version of the heat maps corresponding to the 10 observers, as well as the accumulated heatmaps for the 1147-images experiment.
- Heat maps 1147 raw: raw ‘deltas’ version of the heat maps corresponding to the 10 observers, as well as the accumulated heatmaps for the 1147-images experiment.
- Heat maps cat 136 final: final processed version of the heat maps corresponding to the 10 observers, as well as the accumulated heatmaps for the categorization-task 136-images experiment.
- Heat maps cat 136 raw: raw ‘deltas’ version of the heat maps corresponding to the 10 observers, as well as the accumulated heatmaps for the categorization-task 136-images experiment.
- Heat maps free 136 final: final processed version of the heat maps corresponding to the 10 observers, as well as the accumulated heatmaps for the free-viewing 136-images experiment.
- Heat maps free 136 raw: raw ‘deltas’ version of the heat maps corresponding to the 10 observers, as well as the accumulated heatmaps for the free-viewing 136-images experiment.
- RGB image set 1 (136 images): RGB color images for the experiments using 136 images.
- RGB image set 2 (1147 images): RGB color images for the experiment using 1147 images.
- Spectral imager set 1 (136 images): 8-channels multispectral images for the experiments using 136 images in .mat Matlab format.
- Spectral imager set 2 (1147 images): 8-channels multispectral images for the experiment using 1147 images in .mat Matlab format.
You can download clicking here
The database can be freely used for research and academic purposes. Please cite it properly using the following reference: Eight-Channel Multispectral Image Database for Saliency Prediction, M.A. Martínez-Domingo, J.L. Nieves, and E.M. Valero, Sensors, 21, pp. 970 (2021)
UGR Hyperspectral Image Database
The UGR Hyperspectral Image Database currently contains fourteen hyperspectral reflectance factor images. They were acquired using a volumetric Bragg-grating based hyperspectral imager: hyperspectral camera V-EOS by Photon etc . in outdoor environment in Granada, Spain, from May 2014 to September 2014. The scene contents include trees, buildings, car, motorbike, etc. Most of the images have spatial resolution of 1000 × 900 pixels. The spectral range is from 400 nm to 1000 nm in 10 nm intervals, resulting in total 61 channels.
The 61-channel hyperspectral images are saved losslessly
RGB images are rendered under CIE Standard Illuminant D65 with the CIE 1931 2° Standard Observer with gamma correction (γ = 0.6). They are saved losslessly in tiff image format, 8 bits per channel, and has size about 2.7M per image.
| Scene1 (1000×900) | Scene2 (1000×900) |
|
| Scene3 (1000×900) | Scene4 (1000×900) |
|
| Scene5 (1000×900) | Scene6 (1000×900) |
|
| Scene7 (1000×900) | Scene8 (1000×900) |
|
| Scene9 (1000×900) | Scene10 (1000×900) |
|
| Scene11 (1000×900) | Scene12 (900×1000) |
|
| Scene13 (900×1000) | Scene14 (900×1000) |
IMPORTANT: If you use this data, you must cite the source publication in full: "Outdoor scene reflectance measurements using a Bragg-grating-based hyperspectral imager", J. Eckhard, T. Eckhard, E.M. Valero, J.L. Nieves, E. Garrote Contreras, Applied Optics, vol. 54, N. 13, pp. D15-D24 (2015)
PLEASE NOTE: For commercial use you need to obtain permission from the Color Imaging Lab
Granada daylight spectral database

IMPORTANT: If you use this data, you must cite the source publication in full: J. Hernández-Andrés, J. Romero, J.L. Nieves & R.L. Lee, Jr., "Color and spectral analysis of daylight in southern Europe", Journal of the Optical Society of America A, Vol. 18, N. 6, pp. 1325-1335, June 2001
Spectral Power Distributions of 2600 daylight spectra (global spectral irradiances on a horizontal surface) measured for all sky states during a 2-year period at Granada, Spain. The spectral range was from 300 nm to 1100 nm  . . |
|||
|---|---|---|---|
| Spectral range | 380-780nm | 400-700nm | 300-1100nm |
| Spectral resolution | 5 nm (81 rows) | 5 nm (61 rows) | 5 nm (161 rows) |
| Original data: Spectral Power Distribution of global irradiance | Download MAT file | Download MAT file |
|
| Non-normalized first six eigenvectors (The eigenvectors were calculated without normalization of the daylight spectra) | Download ASCII file | Download ASCII file |
|
| Normalized first six eigenvectors (The eigenvectors were calculated from daylight spectra previously normalized using the L2 norm) | Download ASCII file | Download ASCII file |
|
| Granada standard DAYLIGHT spectra at different correlated colour temperatures. Reconstructed standard daylight spectra from the Granada eigenvectors for different correlated color temperatures.In ASCII data: one spectra per column. | |
|---|---|
| Spectral range | 380-780nm |
| Spectral resolution | 5 nm (81 rows) |
| Correlated color temperatures (Kelvin) | 4500, 5500, 6500, 7500, 8500, 9500, 10000 and 10500 K (see first row of the file) |
| Download ASCII file | |
PLEASE NOTE: For commercial use you need to obtain permission from the Color Imaging Lab
Granada SKYLIGHT spectral database
The spectral skylight data available here (over 1500 skylight spectra) was measured measured during a seven-month period in Granada, Spain. In the paper J. Hernández-Andrés, J. Romero& R.L. Lee, Jr., "Colorimetric and spectroradiometric characteristics of narrow-field-of-view clear skylight in Granada, Spain", Journal of the Optical Society of America A, Vol. 18, N. 2, pp. 412-420, Feb 2001 we use spectral radiances measured within 3° fields of view (FOV's) to define colorimetric characteristics along four sky meridians: the solar meridian and three meridians at azimuths of 45°, 90°, and 315° relative to it. The resulting clear-sky chromaticities in 44 different view directions (1) are close to but do not coincide with the CIE daylight locus, (2) form V-shaped meridional chromaticity curves along it (as expected from theory), and (3) have correlated color temperatures (CCT's) ranging from 3800 K to infinity K. We also routinely observe that sky color and luminance are asymmetric about the solar meridian, usually perceptibly so. A principal-components analysis shows that three vectors are required for accurate clear-sky colorimetry, whereas six are needed for spectral analyses
IMPORTANT: If you use this data, you must cite the source publication in full: J. Hernández-Andrés, J. Romero& R.L. Lee, Jr., "Colorimetric and spectroradiometric characteristics of narrow-field-of-view clear skylight in Granada, Spain", Journal of the Optical Society of America A, Vol. 18, N. 2, pp. 412-420, Feb 2001
PLEASE NOTE: For commercial use you need to obtain permission from the Color Imaging Lab
Daylight spectra generated with SBDART
The global radiation spectrum is affected by a wide range of atmospheric components, including solar geometry, aerosols, gases, cloud cover and surface reflectance properties which all modify the spectral radiation as it passes through the atmosphere and reaches ground level. With an aim of understanding the influence of atmospheric components and phases of daylight on colorimetric specifications of downward radiation, we incorporate a wide range of plausible atmospheric parameters into a radiative transfer code and generate a large set of illuminations which may commonly occur in nature. We investigate colorimetric extension of plausible daylight, sunlight and skylight illuminations and analyze atmospheric components which cause substantial variation in the color of natural illumination. 
You can download clicking here
IMPORTANT: If you use this data, you must cite the source publication in full: Colorimetric analysis of outdoor illumination across varieties of atmospheric conditions, S. Peyvandi, J. Hernández-Andrés, F.J. Olmo, J.L. Nieves, J. Romero, Journal of the Optical Society of America A, vol. 33, n. 6, pp. 1049-1059 (2016)
PLEASE NOTE: For commercial use you need to obtain permission from the Color Imaging Lab
Ishihara spectral database
The whole Ishihara test was captured using a hyperspectral imaging line scanner model PikaL (Resonon Inc. USA). These images were also processed to simulate the effect of VINO and EnChroma glasses different observers: normal, mild deutan, moderate deutan, severe deutan, mild protan, moderate protan and sever protan.

You can download clicking here
IMPORTANT: If you use this data, you must cite the source publication in full: Assessment of VINO filters for correcting red-green Color Vision Deficiency, M.A. Martínez-Domingo, L. Gómez-Robledo, E.M. Valero, R.Huertas, J. Hernández-Andrés, S. Ezpeleta, E. Hita, Optics Express, submitted, (2019)
PLEASE NOTE: For commercial use you need to obtain permission from the Color Imaging Lab